Describing Line Graph
How To Describe a Line Graph
There are three basic things you need to structure an IELTS writing task 1.
- Introduce the graph
- Give an overview
- Give the detail
Introduce the Graph
You need to begin with one or two sentences that state what the IELTS writing task 1 shows. To do this, paraphrase the title of the graph, making sure you put in a time frame if there is one.
Give an Overview
You also need to state what the main trend or trends in the graph are. Don’t give detail such as data here – you are just looking for something that describes what is happening overall.
One thing that stands out in this graph is that one type of fast food fell over the period, whilst the other two increased, so this would be a good overview.
Give the Detail
You can now give more specific detail in the body paragraphs.
When you give the detail in your body paragraphs in your IELTS writing task 1, you must make reference to the data.
Group Data
The key to organizing your body paragraphs for an IELTS writing task 1 is to group data together where there are patterns. To do this you need to identify any similarities and differences.
Sample map Description

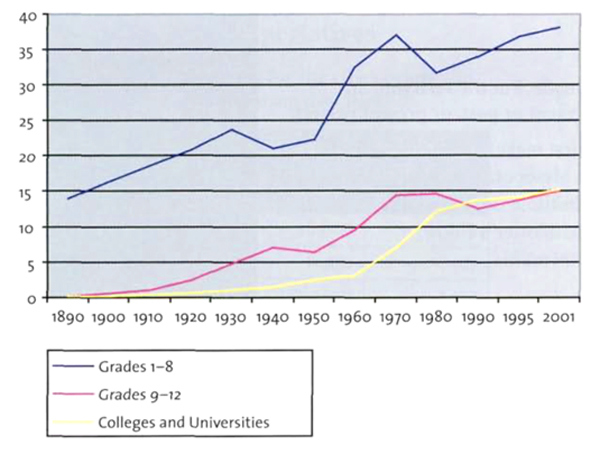
The chart depicts the increase in the number of the people who received an education in the USA in the years 1890 and 2001.
Overall, during the 20th century, there was a discernable improvement in the number of Americans receiving an education at all levels.
At the beginning of the 20th century, numbers contributed to those who were enrolled in grades 1-8 and in grades 9-12 (high school) began to climb. By the end of the twentieth century, figures for the former of the two stood at around 38 million, compared to 15 million for the latter. Only two periods exhibited a decline ---- starting in the 1930s and 1970s in one course, and in the 1940s and 1980s in another course of time for grades 1-8 and 9-12 respectively. Besides, the number of students going on to further education kept growing until the end of the 1960s, when there was a sudden boost. This trend continued until the 1990s, when numbers were at the same level with those leaving high school - roughly 15 million. ( No of Words 176)
| Credit | Description | Bandscore |
|---|---|---|
| LR | There are variety of pertinenet words and expressions used in this description ( Depicts) | 7 |
| C C | majority of the sentences and description are ath the service of the description . No redundencies were found | 7 |
| GR | Applicable and correct grammar was deployed , representing both the current and future statement of the map( The former/ latter) | 7.5 |
| TA | what is anticipated from the description of this map is actually met. | 7 |
| 7+ | ||
 Easenglish